CAMELS-INDIA Dataset: Its Usefulness in Hydrologic Analyses -- a peek through Subarnarekha Basin
- Kunal Konar

- May 13, 2025
- 3 min read
Introduction
Few months Prof. Ashutosh Sharma, IIT-Roorkee via a post in Linkedin brought to my attention the release of CAMELS-India Dataset.
Citation: Mangukiya, N. K., Kumar, K. B., Dey, P., Sharma, S., Bejagam, V., Mujumdar, P. P., and Sharma, A.: CAMELS-INDIA: hydrometeorological time series and catchment attributes for 472 catchments in Peninsular India, Earth Syst. Sci. Data Discuss. [preprint], https://doi.org/10.5194/essd-2024-379, in review, 2024.
With my great delight, I have found that my own Teacher, while I was studying in Indian Institute of Science (IISc), Prof. PPM is also there in the endeavor. So, I have decided to test the usefulness of this Dataset from a hydrologist's point of view and have selected Subarnarekha Basin as my study area of investigation. My study is still ongoing. In this article a portion of this ongoing investigation is presented.
Data Availability
I have analyzed the available observed discharge data for the basin and found that, out of 11 Gauging Sites that have been included in the dataset, only three sites have sufficiently (in the sense of myriad of hydrologic analyses like fitting a rainfall-runoff model or developing a at-Site frequency analysis etc.) large data values. Table-1 illustrates the data availability scenario.

Following Map (Figure-1) of the Subarnarekha Basin provides the spatial context for all these 11 gauging sites.

Clearly, only three sites, namely, Adityapur, Ghatsila and Jamshedpur are there for which data series is available for almost 40 years. Figure-2 shows time series plot of all 11 sites to give a quick idea of the status of the available data across the Subarnarekha Basin.

Flow Duration Curve at Ghatsila Site
With some geo-spatial munging of the associated shapefiles included in this dataset, I have found that Catchment Area draining up to Ghasila site is having largest area among these three sites; Catchment Area draining up to Ghatsila is approx. 14,285.12 sq. km out of 26,828.29 sq. km of the total basin area; i.e. catchment area draining up to Ghatsila site is about 53.25% of the total basin area. So, I have selected discharge time series at the Ghatsila site for a standard hydrologic analysis, namely, Flow Duration Curve.
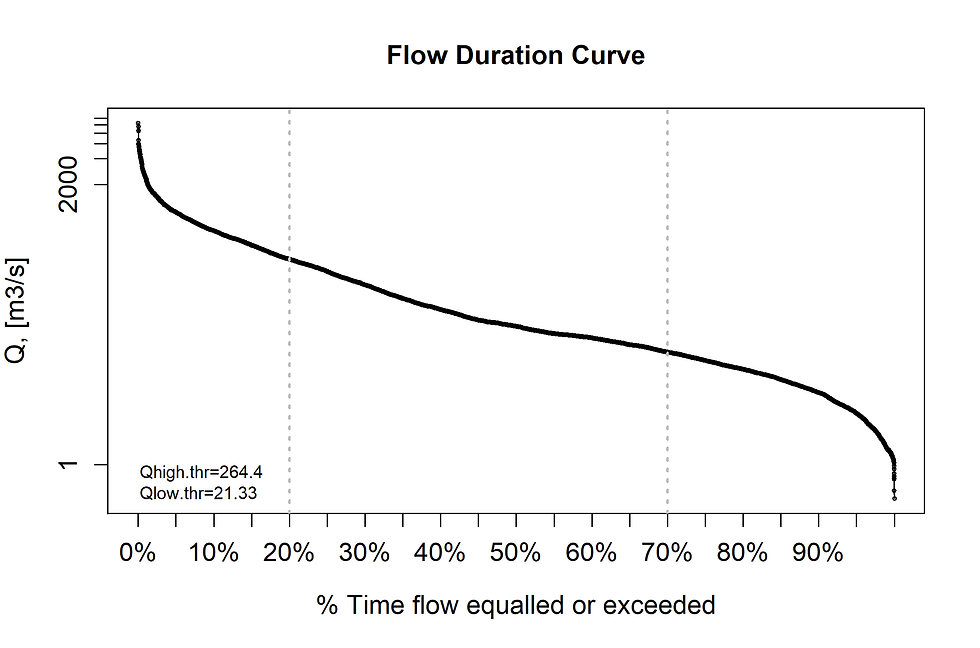
Flow Duration Curve for the discharge time series curve is developed via hydroTSM package in R and are shown in the Figures-3, Figure-4 and Figure-5.


Table-2 summarizes all these three FDCs.

From these curves and figures, following three values are take-home points, Q-95 (i.e. discharge value equals or exceed 95% of the time) is 4.04 cumec; Q-50 is 42.88 cumec and Q-05 is 940.17 cumec.
Conclusion
The above analysis was primaily aimed at testing the usefulness of freely available datasets,such as CAMELS-India, for a practicing hydrologist like myself. As a bonus point we get to know the whole FDC curve of an important river station within India with only two days of effort on my behalf and this FDC curve is typically used for hydro-power plant's hydraulic design and environmental flow calculations. See for example "Flow Duration Curve: an Overview" published in Science Direct from Renewable Energy Conversion System, 2021 [https://www.sciencedirect.com/topics/engineering/flow-duration-curve].
Acknowledgement and Citations
All the data analysis are done via R and some of its associated packages and cited below:
R Core Team (2024). R: A Language and Environment for Statistical Computing. R Foundation for Statistical Computing, Vienna, Austria. <https://www.R-project.org/>
Zeileis A, Grothendieck G (2005). “zoo: S3 Infrastructure for Regular and Irregular Time Series.” Journal of Statistical Software, 14(6), 1-27. doi:10.18637/jss.v014.i06 <https://doi.org/10.18637/jss.v014.i06>.
Sarkar D (2008). Lattice: Multivariate Data Visualization with R. Springer, New York. ISBN 978-0-387-75968-5, <http://lmdvr.r-forge.r-project.org>
Mauricio Zambrano-Bigiarini. (2024) hydroTSM: Time Series Management, Analysis and Interpolation for Hydrological ModellingR package version 0.7-0. URL https://github.com/hzambran/hydroTSM. DOI:10.5281/zenodo.839565
Authorship & Special Notes
Author: Kunal Konar, Consultant -- Analytic Hydrology and Business Development. 25Sep2024; Burdwan, West Bengal, India.
Special Note: This article was first appeared as a LinkedIn Article on 25Sep2024.


Comments